
The PF curve, or probability-failure curve, is a way that you can use data to better drive your asset management practices. This type of chart, which shows the interval of time between the start of a potential failure to an actual failure, allows organizations to get an idea of when or how their assets will fail and plan for maintenance accordingly. This means an increased ability to forecast potential asset failures.
What is the PF curve?
A PF curve is a type of chart that allows you to see the health of an asset as time goes by. It’s a useful tool for planning out maintenance because it can help you visualize data and optimize the balance between reactive and preventive maintenance on an asset.
The letters P and F refer to two different items. The first letter, P, refers to potential failure – something that is predicted based on historical asset performance. The other letter, F, refers to functional failure – the actual moment when an asset fails.
Benefits of using the PF curve
There are a few benefits that can come out of using a PF curve to help manage your assets. See below for a brief list.
PF curves help you plan out maintenance.
Because PF curves use historical data to predict possible asset failure, you can use them to preemptively schedule maintenance so you can get ahead of unexpected downtime.
PF curves help you extend the life of your assets.
PF curves provide a good foundation for the practice of preventive maintenance, which is leagues better than reactive maintenance when it comes to caring for your assets. Instead of dealing with incidents as they come, you can do periodic maintenance ahead of time and keep your assets relatively healthier.
PF curve benefits are directly related to maintenance and asset uptime. By utilizing a PF curve to predict possible times when maintenance is needed, you can save on costly and time-consuming corrective work that might have occurred as a result of reactive maintenance practices. Plus, by using your PF curve to help facilitate preventive maintenance, you can contribute to a more stable and productive asset by staying ahead of potential downtime.
How to read a PF curve
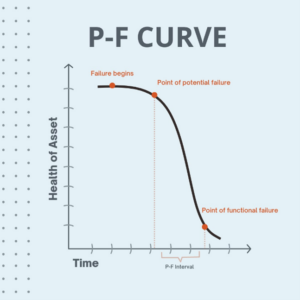
Though the appearance of the PF curve can vary on a case-by-case basis, PF curves typically look like the chart above. There are three important areas on the curve to pay attention to: the point of potential failure, the point of functional (or actual) failure, and the time between both of those points – the PF interval.
The “P” in PF: Potential failure
The point of potential failure indicates a crucial moment in the life cycle of an asset, and as such, it’s important for teams to get on top of preventive maintenance before the indicated point in time. By enacting preventive maintenance when small changes in performance occur, you can prevent potential disasters from occurring.
The “F” in PF” Functional failure
The F point on a PF curve refers to the point of functional failure, which is essentially when the asset physically fails due to a lack of proper maintenance. It’s imperative that you avoid this point whenever possible by keeping up with preventive maintenance tasks as well as by ensuring that maintenance is done well.
The PF interval
The third important area of the PF curve is referred to as the PF interval. The PF interval is the amount of time between the P and F points, which is also the amount of time organizations have between detecting potential issues and when those issues actually happen. This means that extending the PF interval is imperative for asset health and life cycles.
What affects the PF curve?
There are a number of factors that affect the dynamic of a PF curve, such as…
- The nature of the asset or equipment itself. How an asset or piece of equipment handles operation on a day-to-day level is dependent on its design. Variations in the design or materials used make a big impact on the durability of these items.
- How often the asset or equipment is used. Is the equipment being used daily or monthly? Is the frequency of use following the manufacturer’s guidelines for usage?
- User error. Whether by mistake or for the purpose of cutting corners, errors might occur during asset installation, operation, or maintenance. These actions all affect the life cycle of an asset.
- The quality of replacement parts. When replacing components of an asset or equipment, it’s important to use parts that are consistent with the quality recommended by the manufacturer. Otherwise, you might be risking unneeded failures or a reduced asset life cycle.
How to extend the PF interval
Extending the PF interval is crucial if you would like to care for your assets in the best way possible. See below for ways to do so.
Use predictive maintenance to proactively service assets.
If you’re looking to extend the PF interval of your assets, a crucial factor in doing so is implementing predictive maintenance into your asset management routine. Unlike preventive maintenance, which acts as a set schedule that initiates work at a certain time interval, predictive maintenance relies on other factors to determine when an asset should be serviced – all of which are based on the asset’s condition. For example, you might get your car’s oil changed at a certain interval based on mileage, but another way to time maintenance would be to test the oil itself and change it once it degrades past a certain point. This way, you can serve it at the optimal time instead of relying on a factor as noncommittal as time. We recommend using sensors or simply manually testing the different facets of your asset so you always know exactly where its health is at.
Install sensors on your assets.
Installing sensors on your assets takes the guesswork out of deciding when to perform maintenance. With concrete data at your fingertips, you can always know when repairs or replacements are needed, making this maintenance method even more reliable than preventive maintenance (which is based on time rather than sensor readings).
Make sure equipment is being used as intended.
Use equipment and assets as they were intended so that wear and tear are minimized. We also recommend making sure that all personnel are receiving the appropriate training and handling equipment and assets correctly for the same reason.
CMMS and the PF Curve
How do CMMS systems tie in with the PF curve?
CMMS software can help you plan and execute maintenance that extends the PF interval, thereby increasing the life cycle of your assets. To learn more, click the button below to check out NEXGEN today.